The First Rule of Data Club
I know what most of you are thinking, but no. While the second rule of Data Club should most definitely be to not refer to data as a singular noun (although “No Smoking” would also be a strong contender), I believe that probably the most fundamentally important rule for anyone working with data of any description is to understand data types.
 Source: xkcd.com
Why is it so important to understand data types?
Generally speaking, the intercedent steps between acquiring, importing and cleansing a data set and then communicating the findings extracted from it will involve one or more iterations of describing and summarising, visualising and modelling the data. The importance of being able to understand and identify types of data in a data set is that it prescribes both the descriptive and inferential statistical methods and graphical visualisation techniques that can or should be applied during this process. It can literally dictate the success of your entire analysis workflow!
So before we dip our toes into the syntactic and programmatic complexities of scripting our analyses in any language, before we model and visualise, before we clean and reshape, before we even think about contemplating retrieving and importing data, the first thing we should do is take a quick look at data types.
What’s a Ghosts Favourite Data Type?
When I say “Data Types” I am talking about the types of structured data used in the field of statistics. Unstructured data (e.g. text and documents, multimedia files, internet logs etc.) do exist and are potentially very useful (particularly after considerable processing) but these subjects are outside the scope of this post. Also, you might come across an array of classifications used to describe data in various scientific disciplines or programming languages that are not discussed below. These are often synonymous, overlapping and field-specific terms or objects used to further classify or store statistical data types. This can all get very confusing but a solid understanding of the following basic concepts will serve you well in getting to grips with this topic.
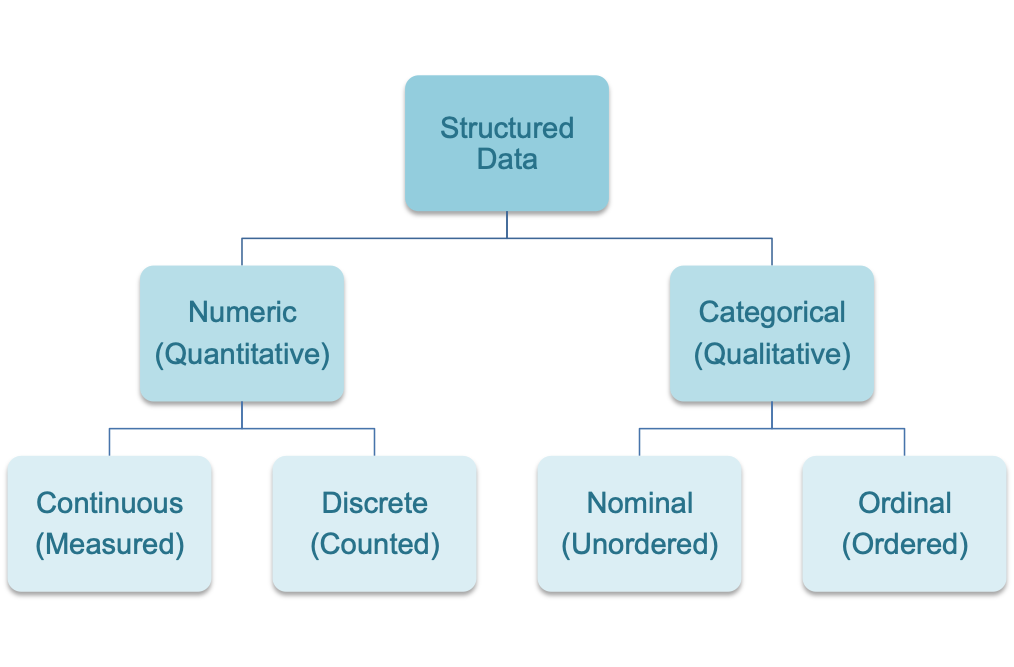
Broadly speaking, data can be split into numerical (quantitative) and categorical (qualitative) data. Numerical data, which unsurprisingly takes the form of numbers, can be further sub-divided into continuous or discrete types. Continuous numerical data is that which is measured (e.g. the speed of a bus or the length of time you spend waiting for one to turn up) while discrete numerical data is that which is counted (e.g. the number people sat on the bus or the number of pieces of litter strewn across the floor). I love public transport.
A quick note: you might see numerical data types discussed as being on interval or ratio scales but these are levels of measurement. A potential topic for a post in the future.
Categorical data can be sub-divided into either nominal or ordinal types. Nominal categorical data has no intrinsic order (e.g. vital or marital status); no category is ranked as better or worse than any other (although the dead or married individuals amongst you might disagree). Ordinal categorical data does have an intrinsic order (e.g. a rating scale of agree - indifferent - disagree). You might also encounter categorical variables represented using numbers (e.g. alive = 0 and dead = 1) but this doesn’t necessarily mean that they are numeric variables.
Just in case you were wondering, the answer to “What’s a Ghosts Favourite Data Type?” is “Boooolean”. Terrible. Hopefully though, you can at least now tell the ghost that Boolean values are nominal categorical data before proceeding to call 555-2368.
Thanks for reading. I hope you enjoyed the article and that it helps you to get a job done more quickly or inspires you to further your data science journey. Please do let me know if there’s anything you want me to cover in future posts.
Happy Data Analysis!
Disclaimer: All views expressed on this site are exclusively my own and do not represent the opinions of any entity whatsoever with which I have been, am now or will be affiliated.